
The Sandbox (SAND) price is in the process of breaking out from a short-term corrective pattern which could accelerate the upward movement toward $0.98.
Despite the ongoing SAND price increase, there is some upcoming negative The Sandbox news. On Feb. 14, 348 million SAND tokens will be unlocked to seed and strategic investors. This will cause an increase of roughly 23% in the current supply of 1.5 billion tokens. The previous such unlock caused a fall of 20% a few days after the event. Therefore, a similar plunge could follow after Feb. 14. Since the maximum supply is three billion, several other unlocks will eventually follow.
The Sandbox Price Validates Support
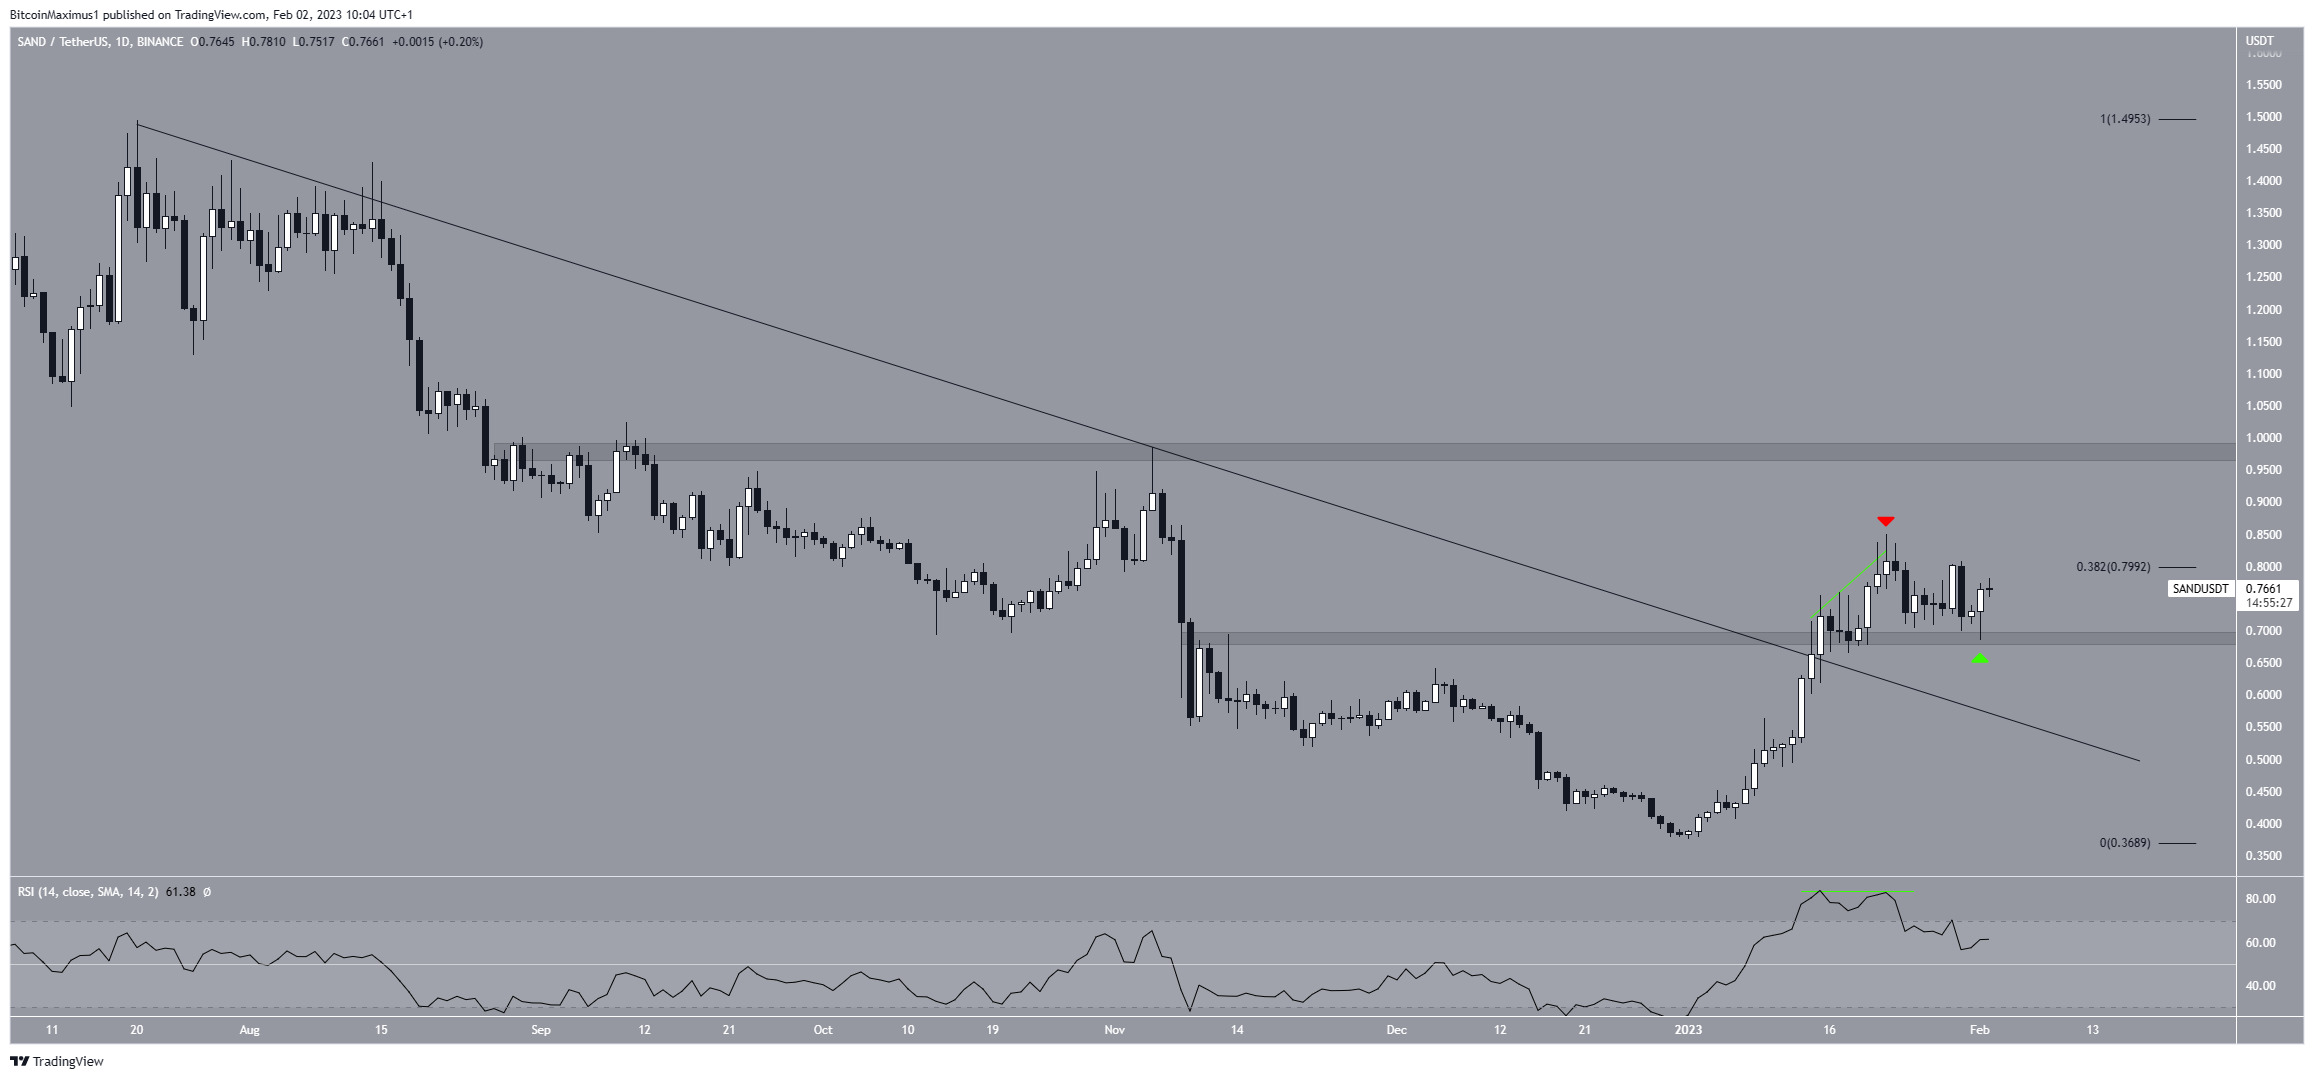
SAND is the utility token of the play-to-earn The Sandbox game in the Ethereum blockchain. Since Jan. 1, The Sandbox price has increased by 110%, leading to a high of $0.85 on Jan. 22. The upward movement also caused a breakout from a descending resistance line.
Afterward, the daily RSI generated bearish divergence (green line), catalyzing the current fall.
On Feb. 1, the digital asset created a bullish candlestick, bouncing and validating the $0.69 horizontal area as support. Therefore, the most likely outlook is the continuation of the upward movement toward the next resistance at $0.98.
On the other hand, a close below the $0.69 horizontal support area would invalidate this bullish price forecast and catalyze a fall to $0.55.
Short-Term Breakout Could Accelerate Increase
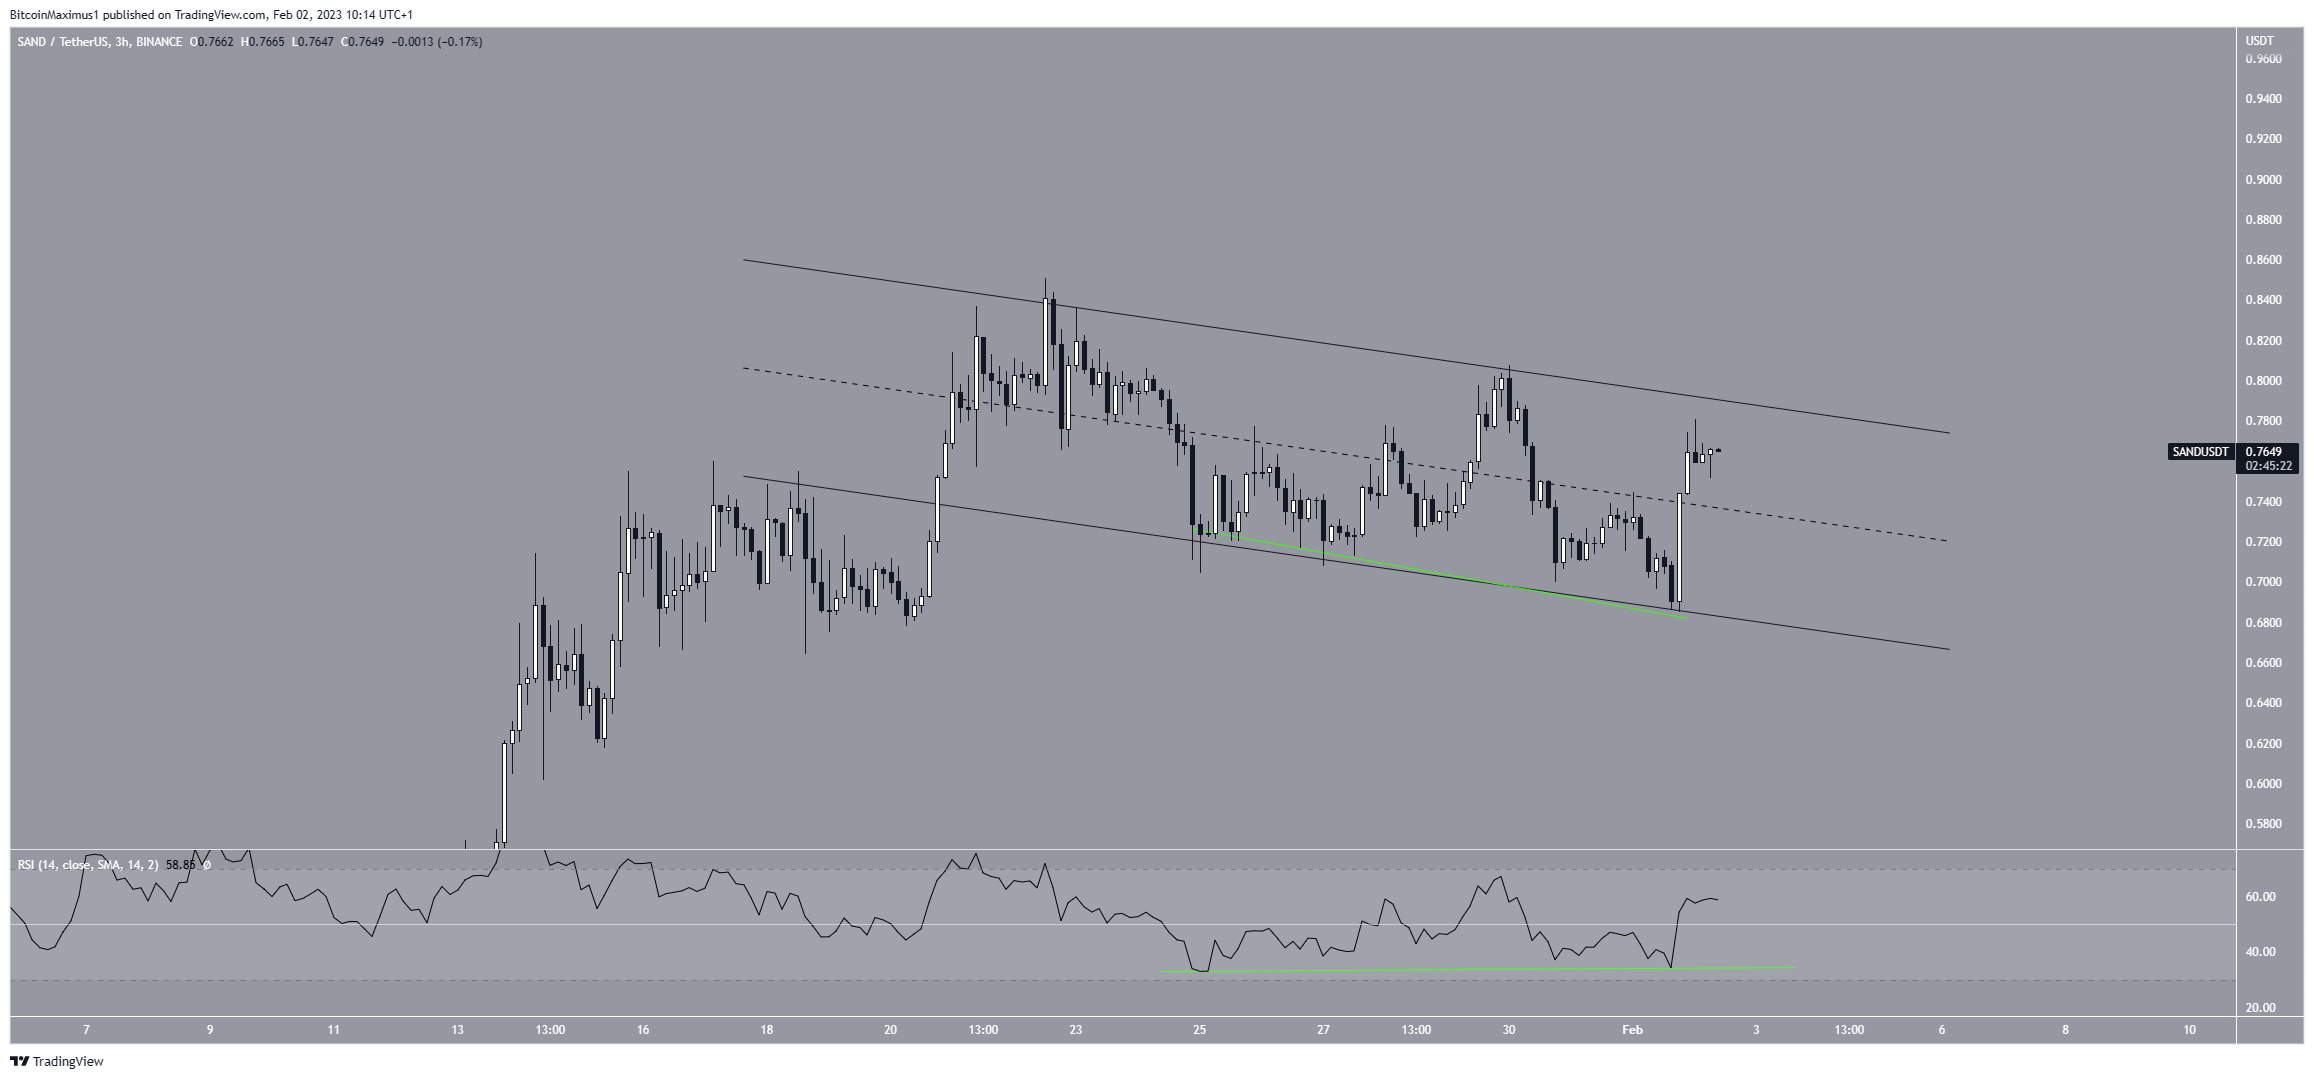
The technical analysis from the short-term three-hour chart provides a bullish outlook. There are two main reasons for this:
Firstly, the SAND price is trading inside a descending parallel channel, which is considered a bullish pattern.
Secondly, the three-hour RSI has generated bullish divergence (green line), which was confirmed over the past 24 hours. Both are signs associated with bullish trends.
As a result, a breakout from the channel could catalyze an increase toward the previously outlined $0.98 resistance area.
To conclude, the most likely SAND price forecast is the continuation of the upward movement toward $0.98. A daily close below $0.69 would invalidate this positive outlook and could send the SAND price down toward $0.55.